


Introduction: Why Problems Keep Coming Back (Even After “Fixes”)
Every organization wants better outcomes—fewer defects, faster delivery, happier customers, and predictable performance. Yet when results start slipping, most teams go into firefighting mode. More reviews. More pressure. More follow-ups. More “urgent” calls.
For a short time, things improve. Then the same problems return.
This cycle repeats because teams try to fix the result instead of fixing what caused the result. In Six Sigma, this misunderstanding is addressed by a simple but powerful idea:
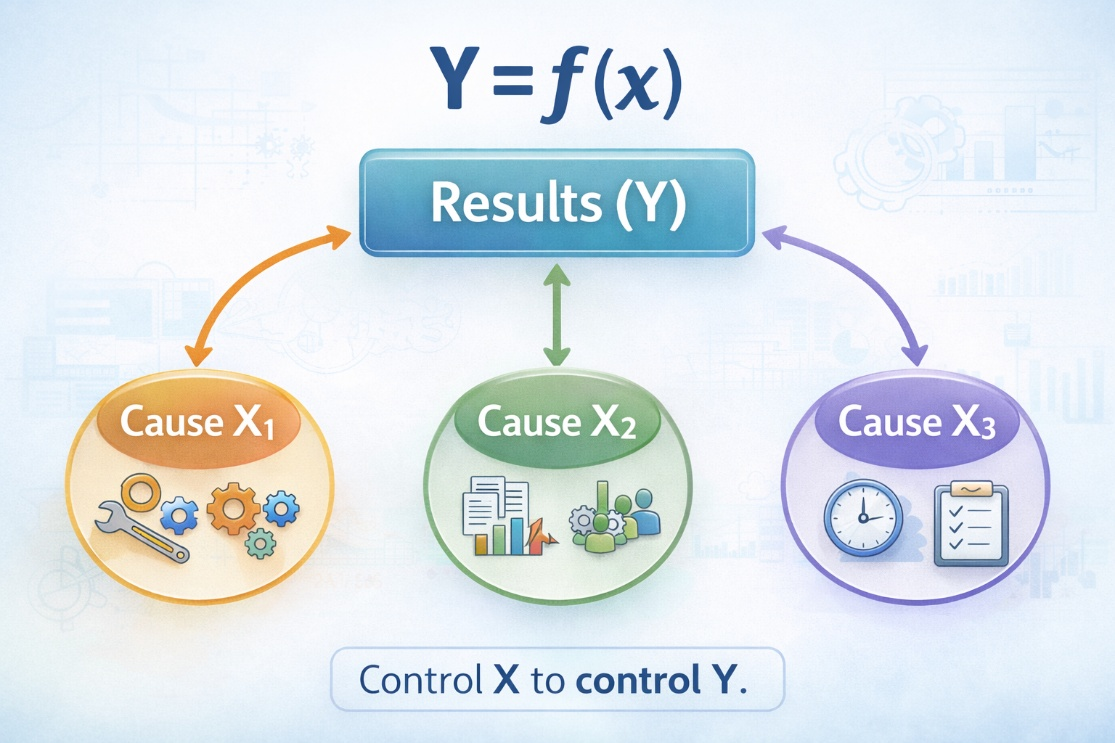
Y = f(x)
Your results (Y) are a function of your causes (X).
Once teams internalize this, problem-solving changes from reactive to systematic—and improvements begin to sustain.
In any process, Y represents the outcome you want to improve:
- Defect rate
- Turnaround time
- Customer complaints
- SLA breaches
- Sales conversion
- Rework percentage
These are called output variables or dependent variables—they depend on what happens inside the process.
X represents the inputs and conditions that shape those outcomes:
- People (skills, training, fatigue, adherence to SOPs)
- Machines (settings, calibration, downtime)
- Methods (handoffs, approvals, rework loops)
- Materials/Data (quality, completeness)
- Measurement (definitions, inspection methods)
- Environment (workload, system uptime, distractions)
These are independent variables. When X changes, Y changes. When X is unstable, Y becomes unstable.
The core message:
You can’t command results to improve.
You can only improve the process conditions that create those results.
Why Fixing Only the Output Never Works
When defects rise, common reactions include:
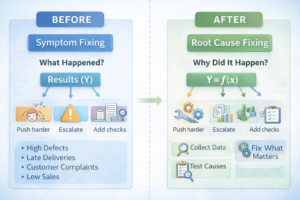
- Pushing people harder
- Adding more checks
- Escalating to managers
- Extending working hours
These actions may temporarily improve numbers. But they don’t remove the reason the problem occurred. Results are produced by the process. You can’t sustainably change results without changing the process conditions.
This is the mindset shift Y = f(x) creates:
From “who failed?” to “which variable changed?”
This reduces blame, increases clarity, and builds ownership of the process.
A Simple Real-Life Analogy (Why Treating the Wrong Cause Fails)
Think of a headache. The headache is Y (the effect). Possible causes (X) include lack of sleep, dehydration, eye strain, stress, or infection. If dehydration is the cause and you take a stress tablet, the headache persists.
Organizations do the same:
- Complaints rise → send warning emails
- Delays increase → push overtime
- Defects rise → scold operators
If the real cause is poor machine calibration or unclear SOPs, none of these actions will fix the problem. Six Sigma teaches teams to validate causes with data before acting.
Applying Y = f(x) to a Real Business Problem (Step-by-Step)
Imagine a defect rate of 8% with a target of 4%.
Step 1: Identify Possible Causes
Teams brainstorm broadly: machine settings, training gaps, material quality, shift differences, workload spikes, unclear SOPs. This may yield 30–50 possible X’s.
Step 2: Prioritize Likely Causes
Using process maps and Cause & Effect Matrices, narrow down to 10–15 likely contributors. This focuses effort.
Step 3: Validate the Critical X’s with Data
Collect data for shortlisted X’s. Use Pareto, correlation, regression, or hypothesis testing to identify the 3–5 critical X’s that truly drive defects. This often yields a practical relationship like:
Y = aX₁ + bX₂ + cX₃
Step 4: Improve Only What Matters
Design solutions that directly target the critical X’s. Avoid spreading effort across low-impact factors.
Step 5: Control the X’s to Sustain Results
Set controls for critical X’s (standard work, control charts, audits). When X remains stable, Y remains stable.
Tools That Help You Find and Control the Critical X’s
- Process Mapping:See where X’s enter the process
- Fishbone (Cause & Effect):Structure hypotheses
- Pareto Analysis:Focus on the vital few X’s
- Regression/Correlation:Quantify relationships
- DOE (Design of Experiments):Test cause-effect rigorously
- Control Charts:Keep critical X’s stable over time
These tools turn Y = f(x) from theory into action.
The Cultural Shift Y = f(x) Creates
Before Y = f(x), teams ask:
- Why are people not performing?
- Why are targets not met?
After Y = f(x), teams ask:
- Which process variable changed?
- Which input went out of control?
- Which root cause is driving this result?
This shift reduces blame, improves clarity, and creates predictable performance.
Common Pitfalls (Why Teams Struggle to Apply Y = f(x))
- Jumping to solutions without validating causes
- Treating all causes as equal (not prioritizing critical X’s)
- Collecting data without clear definitions
- Failing to control X’s after improvement
- Treating Y = f(x) as a slogan, not a method
Avoiding these pitfalls is what separates short-term wins from sustained improvement.
Final Takeaway: Control the Cause, and the Result Takes Care of Itself
If the same problems keep returning, the issue isn’t effort—it’s focus. When teams focus on the result, problems resurface. When teams control the right causes, results stabilize naturally.