


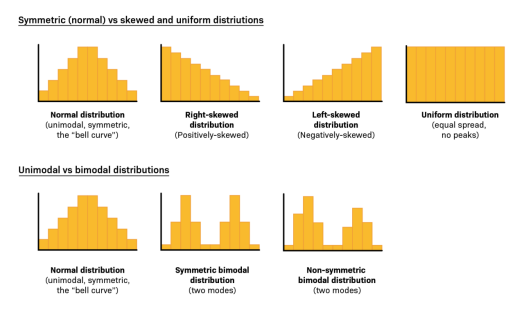
Histogram in Six Sigma: A Practical Guide to Understanding Process Behavior and Data Distribution – Part 2
Understanding the Shape of Your Data Histograms help identify the shape of the distribution, which directly informs how you analyze...
Continue Reading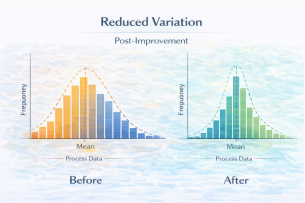
Histogram in Six Sigma: A Practical Guide to Understanding Process Behavior and Data Distribution – Part 1
In process improvement, the most dangerous phrase is: “The average looks fine.” Averages hide problems. Two processes can have the...
Continue Reading